PROJECT OBJECTIVE
Create an online portal for UPS to share key warehouse performance metrics and data with their clients.
THE PROBLEM
All metrics were measured and reported through Excel spreadsheets, email, and SharePoint. The processes involved a lot of manual manipulation and exchanging various physical artifacts. Analysis was done piecemeal, on demand, and was limited. UPS fell behind its clients’ expectations for contemporary data visibility and business intelligence capabilities.
CONTEXT
The Global Logistics & Distribution (GLD) Department at UPS manages the infrastructure and supply chains for companies around the world. Their services include inventory storage and management, order processing, transportation, returns, and service parts logistics.
PROJECT OUTCOME
Two years later, we had a working Global Logistics and Distribution Portal showing data for the inbound, inventory, and outbound warehouse operations for four warehouse facility types. The Portal had a KPI reporting area (online Scorecard), a Dashboard, a Reports area with a data collection tool, and an online space for sharing additional data. The project was then handed over to a third party for further development. The current UPS Supply Chain Symphony Portal is heavily based on the initial research and prototypes that my team and I worked on.
Timeframe
2019-2021
Client
Global Logistis and Distribution, UPS
CHALLENGES AND MY ROLE

Creating from Scratch
Create a digital tool from scratch that was entirely new for the department. The subject matter was complex, industry and UPS-specific. I guided the team through a human-centered process and grounded the design decisions on research.

Shaping a Shared Vision
The business had no shared vision about the Portal. Through interviews, data analysis, prototypes, and actively seeking users’ feedback, I helped the team reach a shared vision for the project. I collaborated with both UPS and a client of theirs to make sure the Portal met the needs of various users.

Learning While Delivering
The project was urgent, and we had to learn and deliver at the same time. The business often referred to our task as “changing the engine while the plane (was) flying.”

Making Space for User Experience Design
The business had no previous experience with UX design and process. They did not understand the importance of UX research, prototyping, and iteration or the required time and effort. I demonstrated the benefits of user research, testing, and iteration by regularly working with users, stakeholders, other designers, and engineers.

Team Leadership
The design and development teams that were brought together were new to UPS and each other. I helped assemble the design team, insisted both all collaborated, and provided guidance and direction.
Skills
UX research
Problem definition and prioritization
Big picture thinking
UX process
Prototyping
Data visualization
Concept presentation and feedback gathering
Visual communication
Team leadership
Content strategy
Passion for solving problems and helping users
Testing data for accuracy and consistency
CASE STUDY
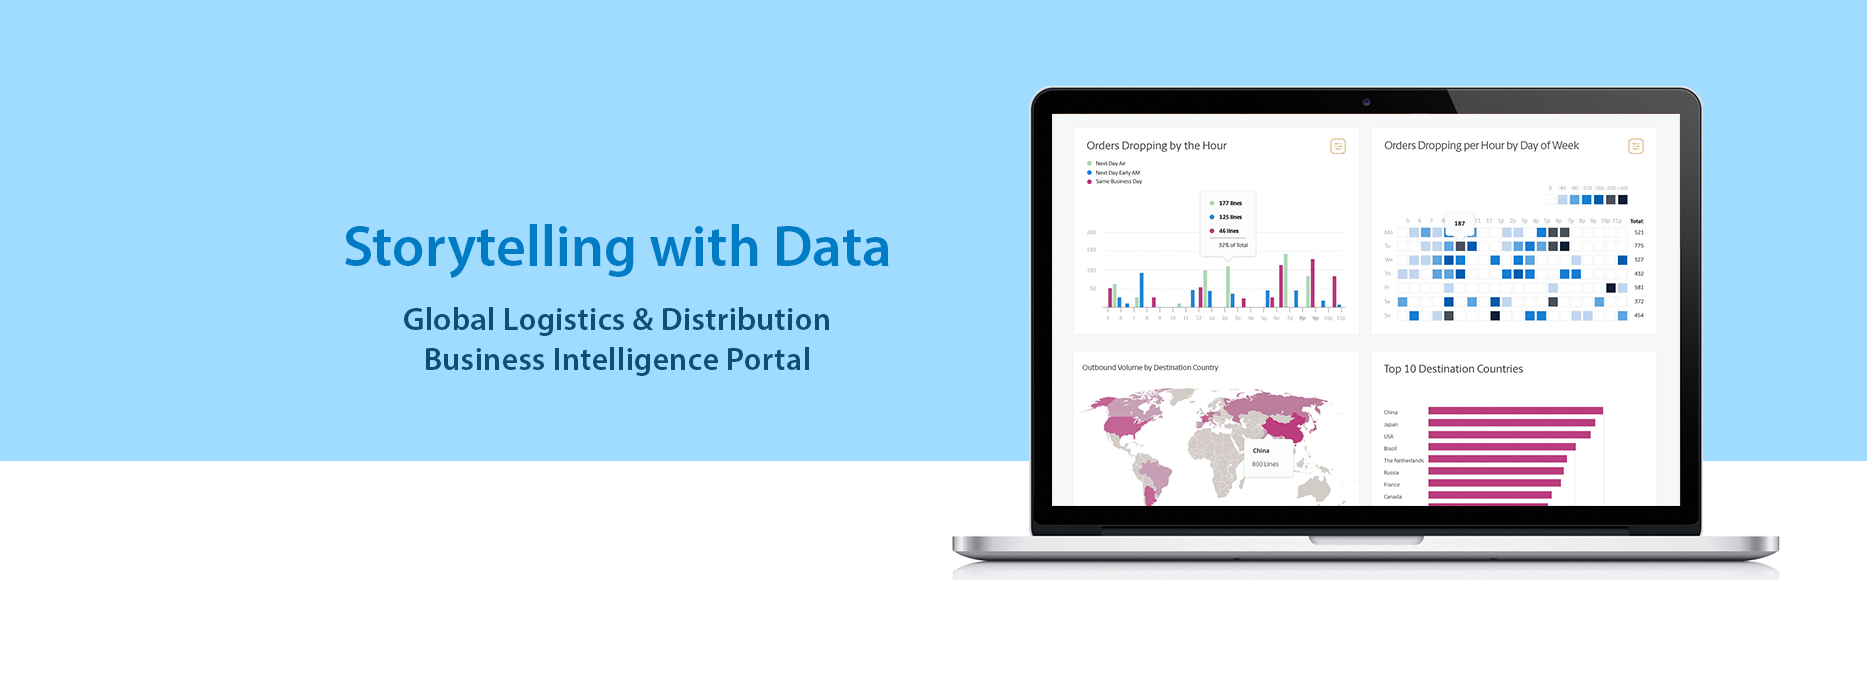
Storytelling with Data
As a Sr. UX Designer for the Global Logistics and Distribution Business Intelligence Portal:
I planned and conducted all UX research while guiding the team in synthesizing the findings.
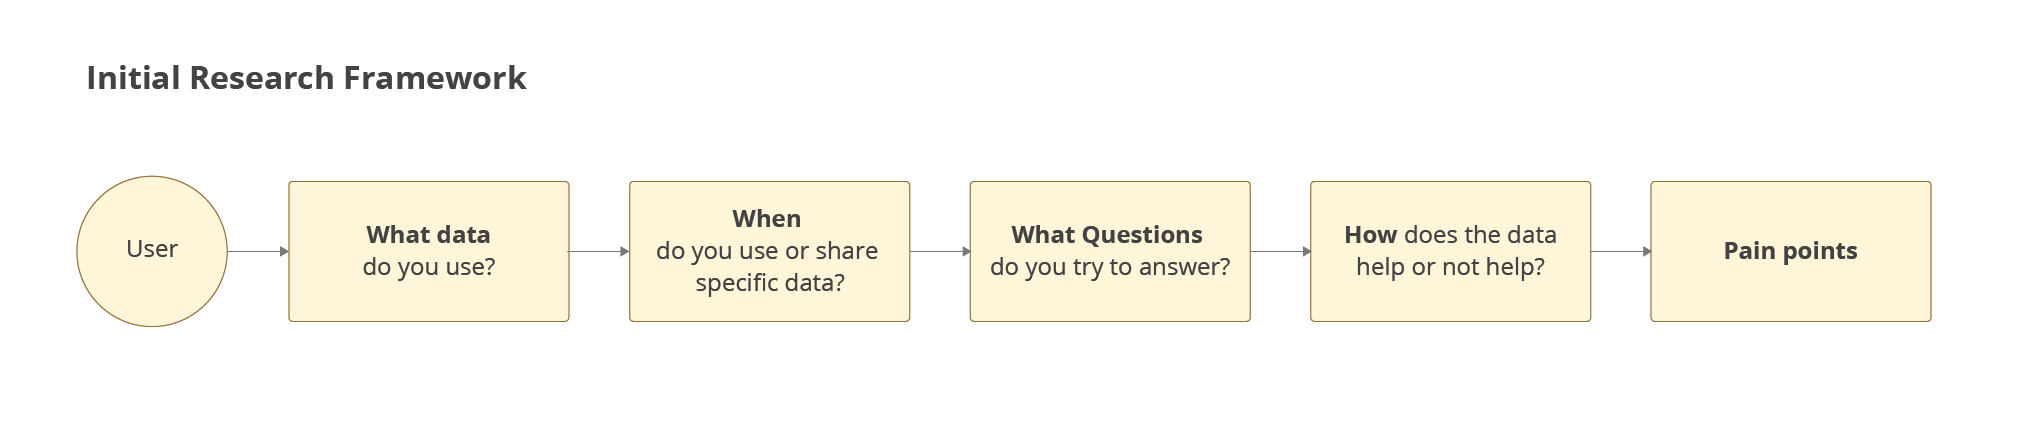
I developed a framework for understanding users' data needs and thought processes for root cause analysis.
I collaborated with users to create meaningful data visualizations and represented the users’ voices in all discussions.
I led the Design team in conceptualizing and designing a reporting and data collection tool.
UX Research
User Interviews
I planned and conducted in-person and online interviews with UPS warehouse managers, supervisors, and UPS and client regional supply chain managers from three geographical areas (AMAC, EMEA, and APAC).
Observation and Shadowing
I visited the AMAC Regional Distribution Center, observed the warehouse operations, and interviewed warehouse managers and operations supervisors.
I was invited to the daily status calls between the warehouse’s operations supervisors, and client counterparts.
Data Analysis
I collected and analyzed the data shared between UPS and their client. I looked at what was reported, why, and how the documents were used.
I shared my research with the team to facilitate understanding and collaboration.
Storytelling with Data
As someone with a background in graphic design, I was excited about the challenge of making data visible and understandable. "Storytelling with Data" by Cole Nussbaumer Knaflic was instrumental in helping me clarify and define our goal: enable Portal users to utilize data to create narratives about the health of their supply chain and the performance of their warehouses.
Making Sense of Users’ Needs for Data
Discovering Users and Data Used
I designed and conducted about 20 interviews with UPS warehouse supervisors, regional and global supply chain managers, and their client counterparts. The interviews focused on three primary warehouse operations - Inbound, Inventory, and Outbound.
The first set of interviews were focused on the data used and the current processes.
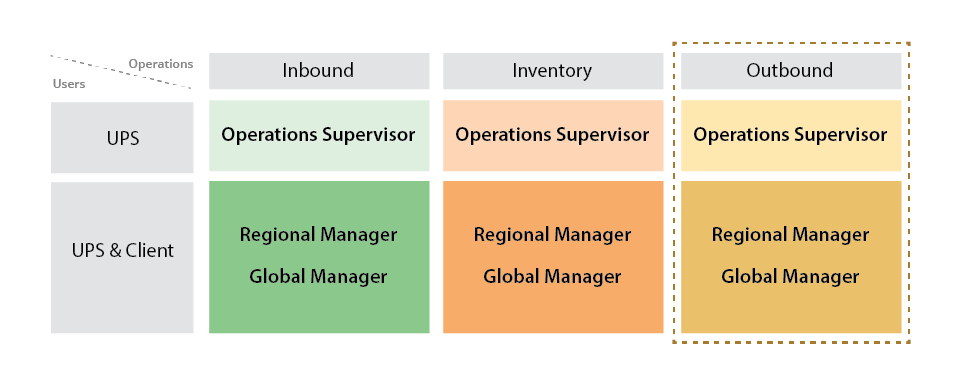
User Types
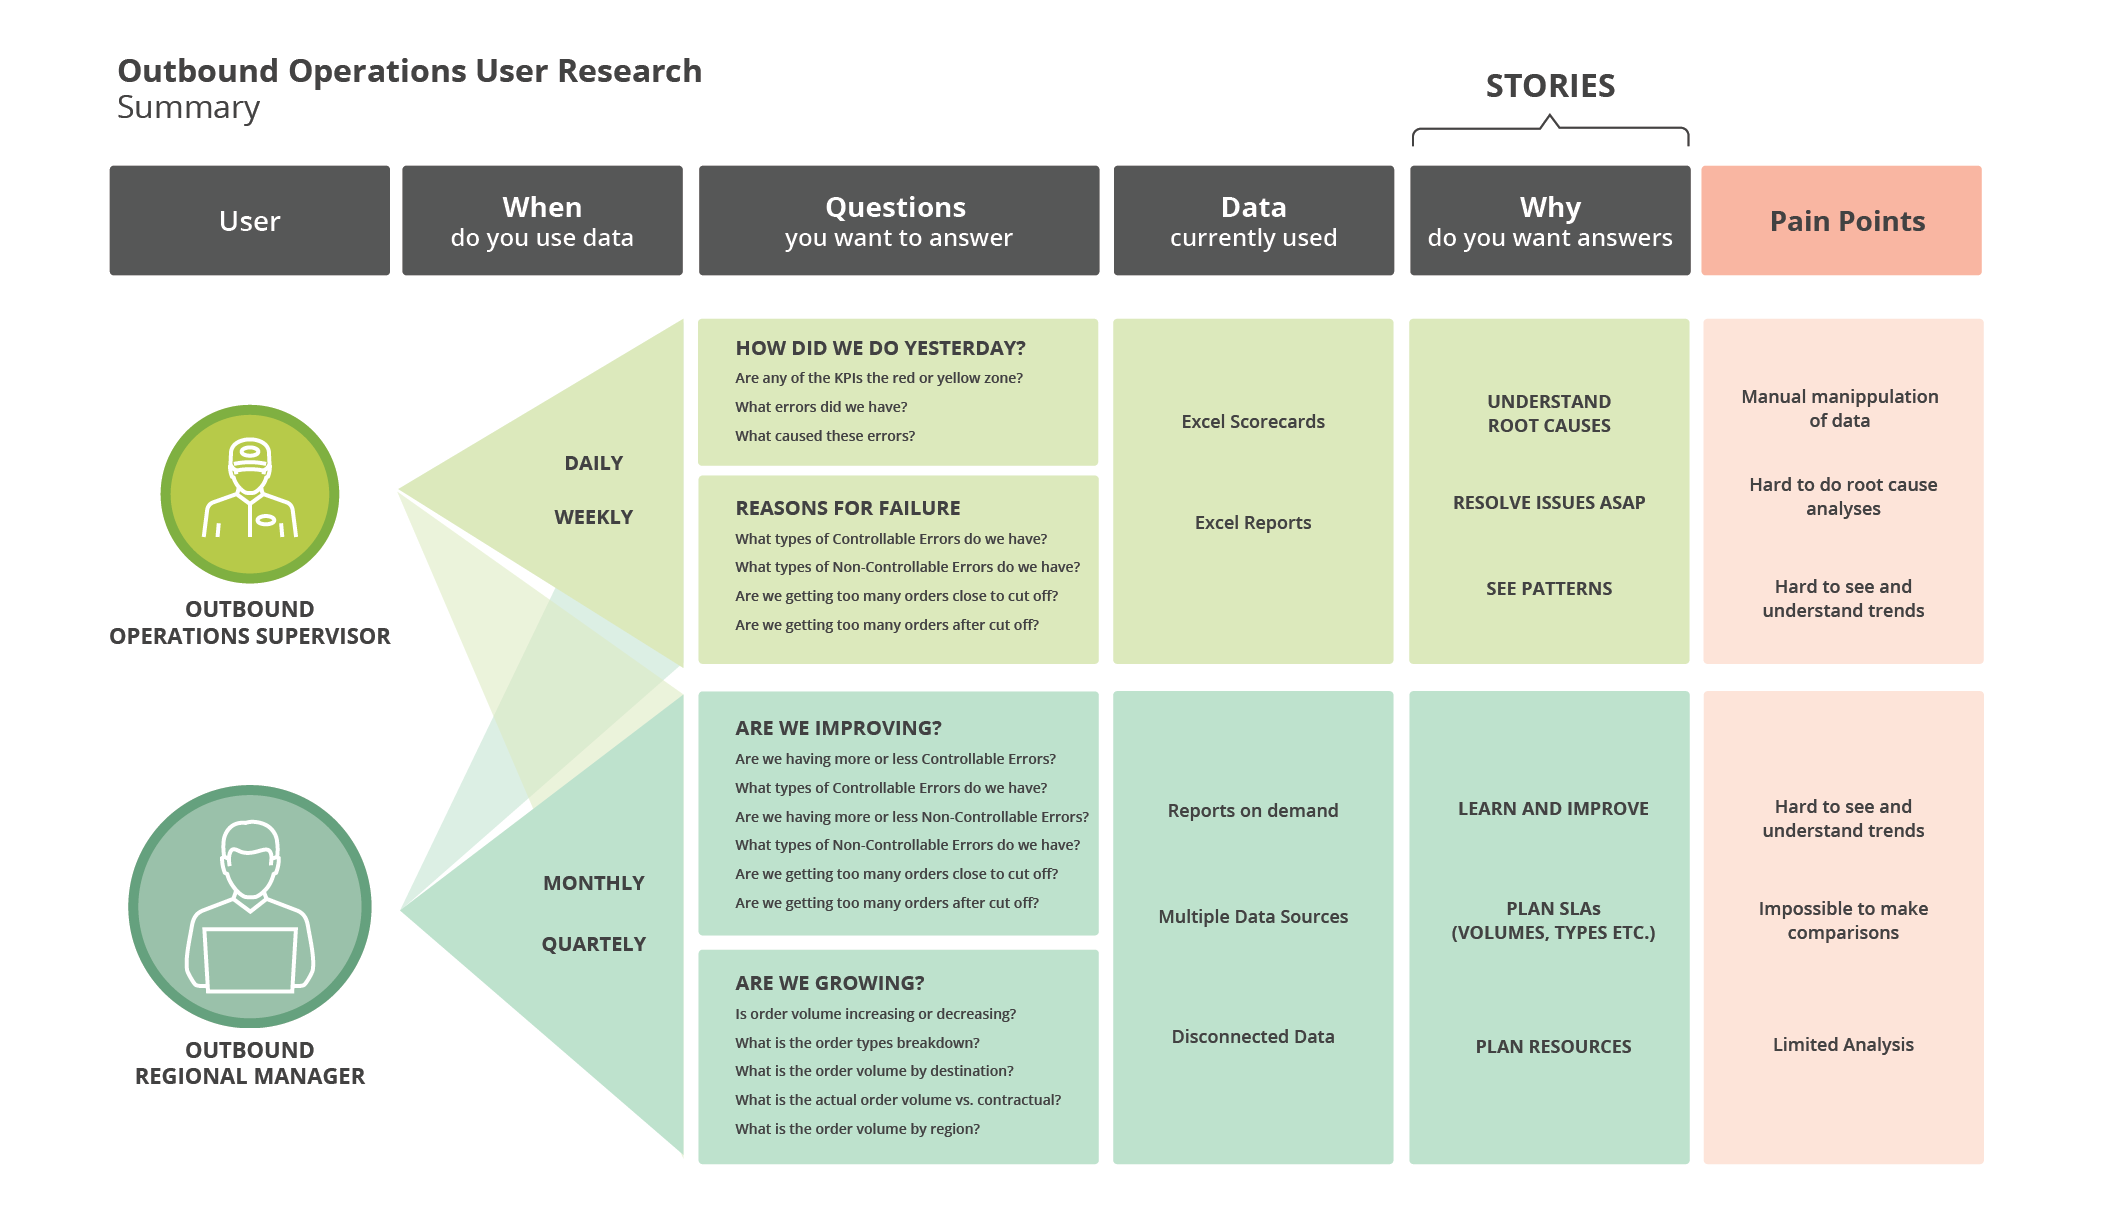
The interviews helped us identify 6 user types. The primary differentiator was the type of data and analysis a particular user group needed. For the purpose of this case study I will focus only on the Outbound users - Operations Supervisor, and Regional and Global Managers.
Emerging Stories
The research focused on understanding the data used and why it was needed. By continuously asking, “Why?” I began to recognize interconnected patterns that resembled the building blocks of stories.
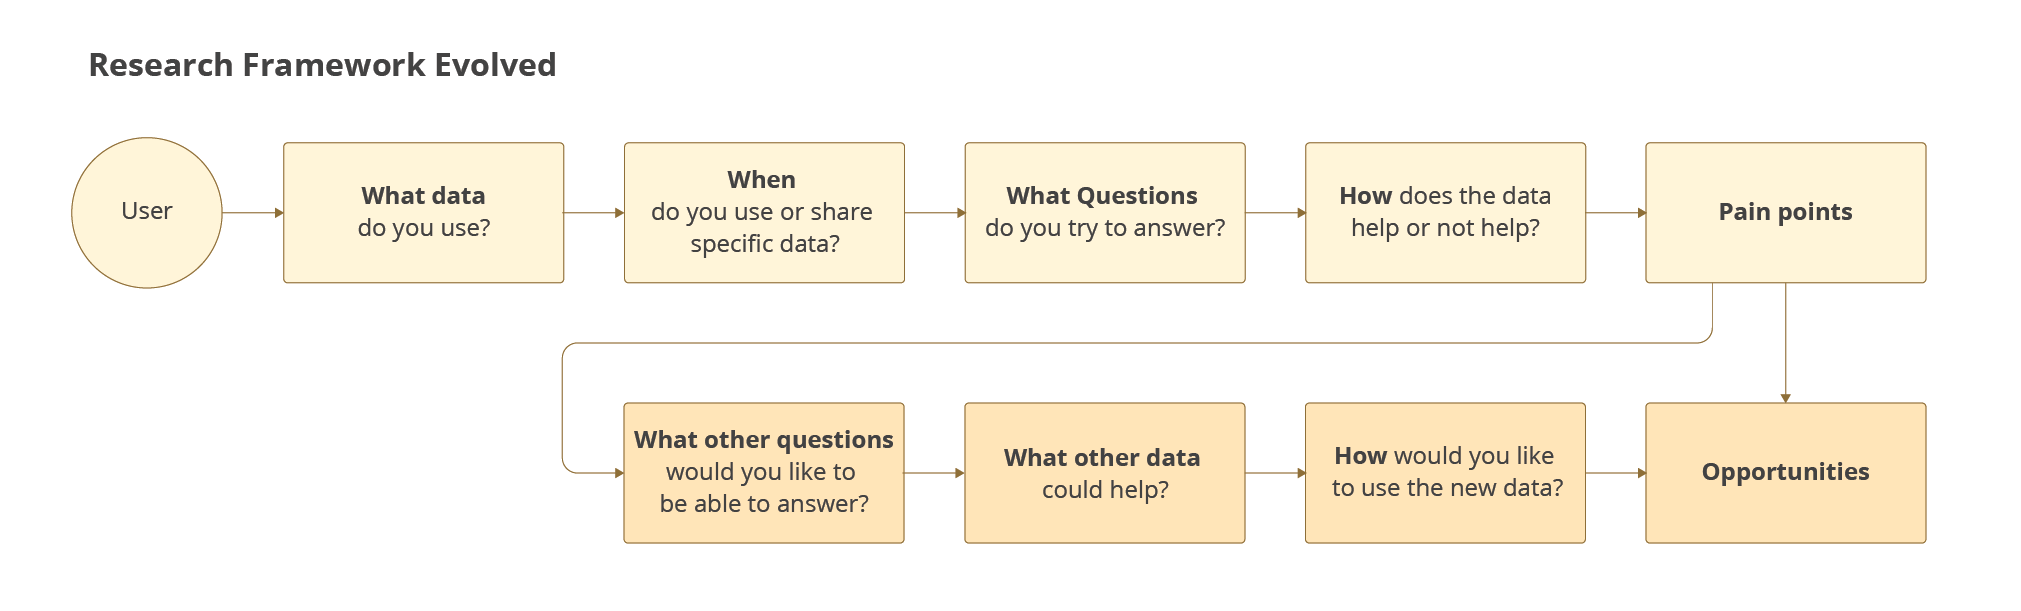
Evolving Stories
After the initial interviews, I organized my further research to explore how the questions asked could be answered more effectively and thoroughly.
A visual representation of the relationship between high-level stories, questions asked, and the data necessary to monitor outbound operations. This representation differentiates between existing capabilities and the future capabilities that were needed.

Concept and Prototype Development
Key Take Aways from the Research
The following key pain points emerged from the interviews:
It was hard and almost impossible to see trends and make comparisons because of a lack of data or access to disconnected data
It was very hard to perform root cause analysis
These insights focused the design exploration around enabling users to find answers from the data and understand trends.
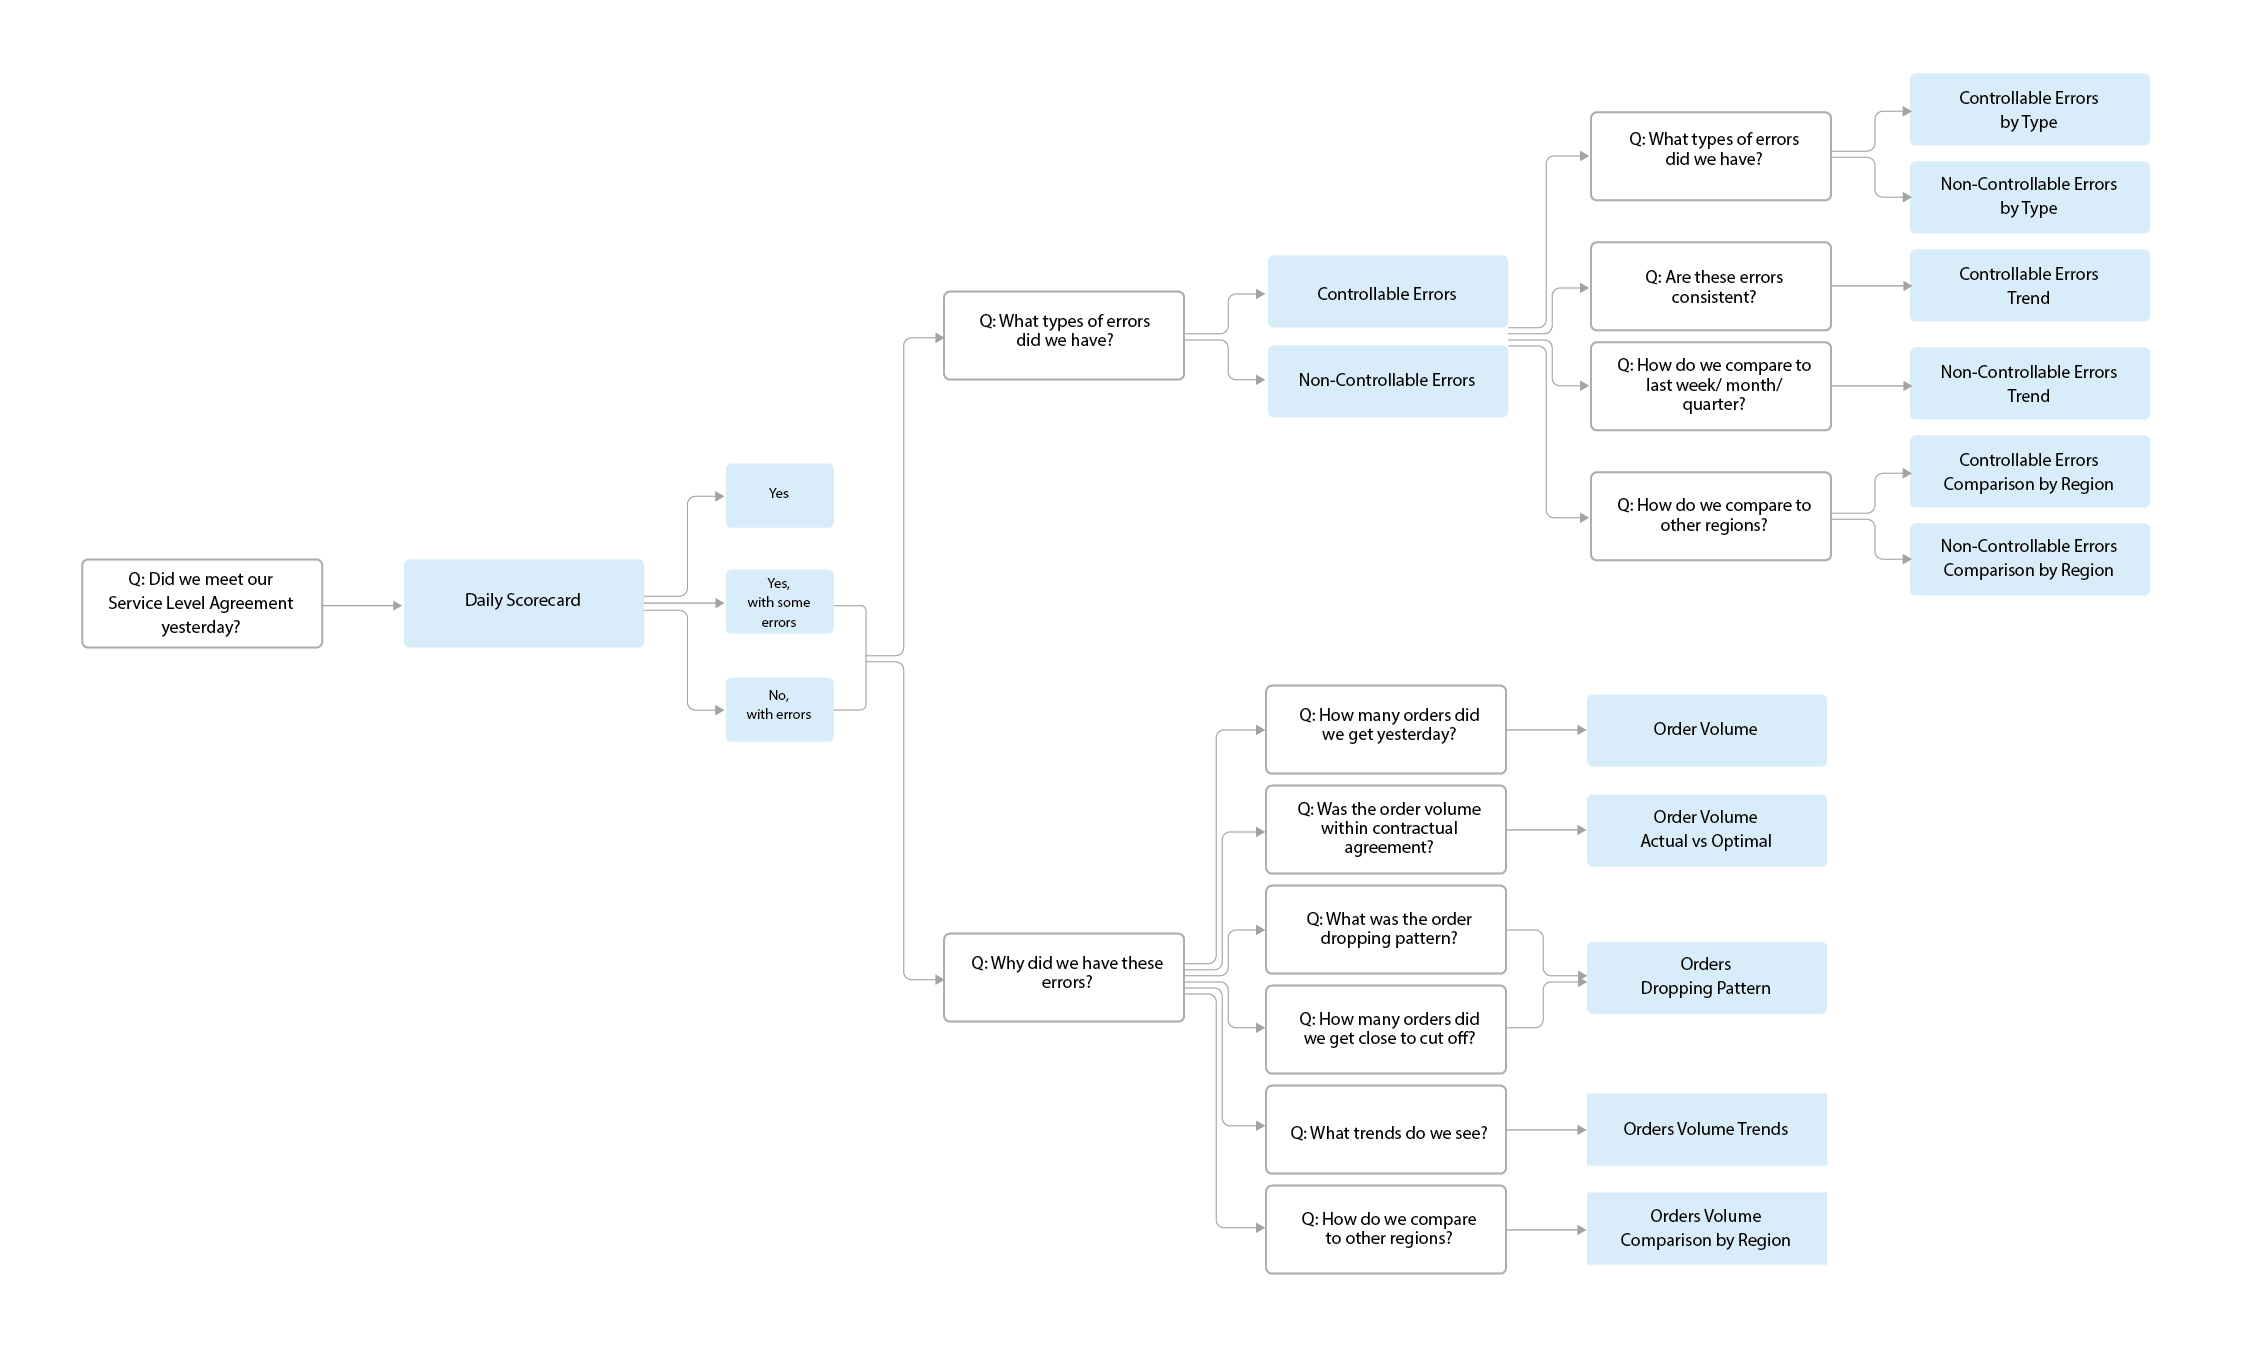
Building Stories with Data
“Did we meet our service agreement?” was a question UPS answered every morning during a daily call with their clients. Traditionally, it was responded to by sharing an Excel scorecard and reports prepared the night before.
The interviews helped map out the thought process for error analysis as a series of questions. Then, we identified data that helped answer the questions. This became the framework for our storytelling with data.
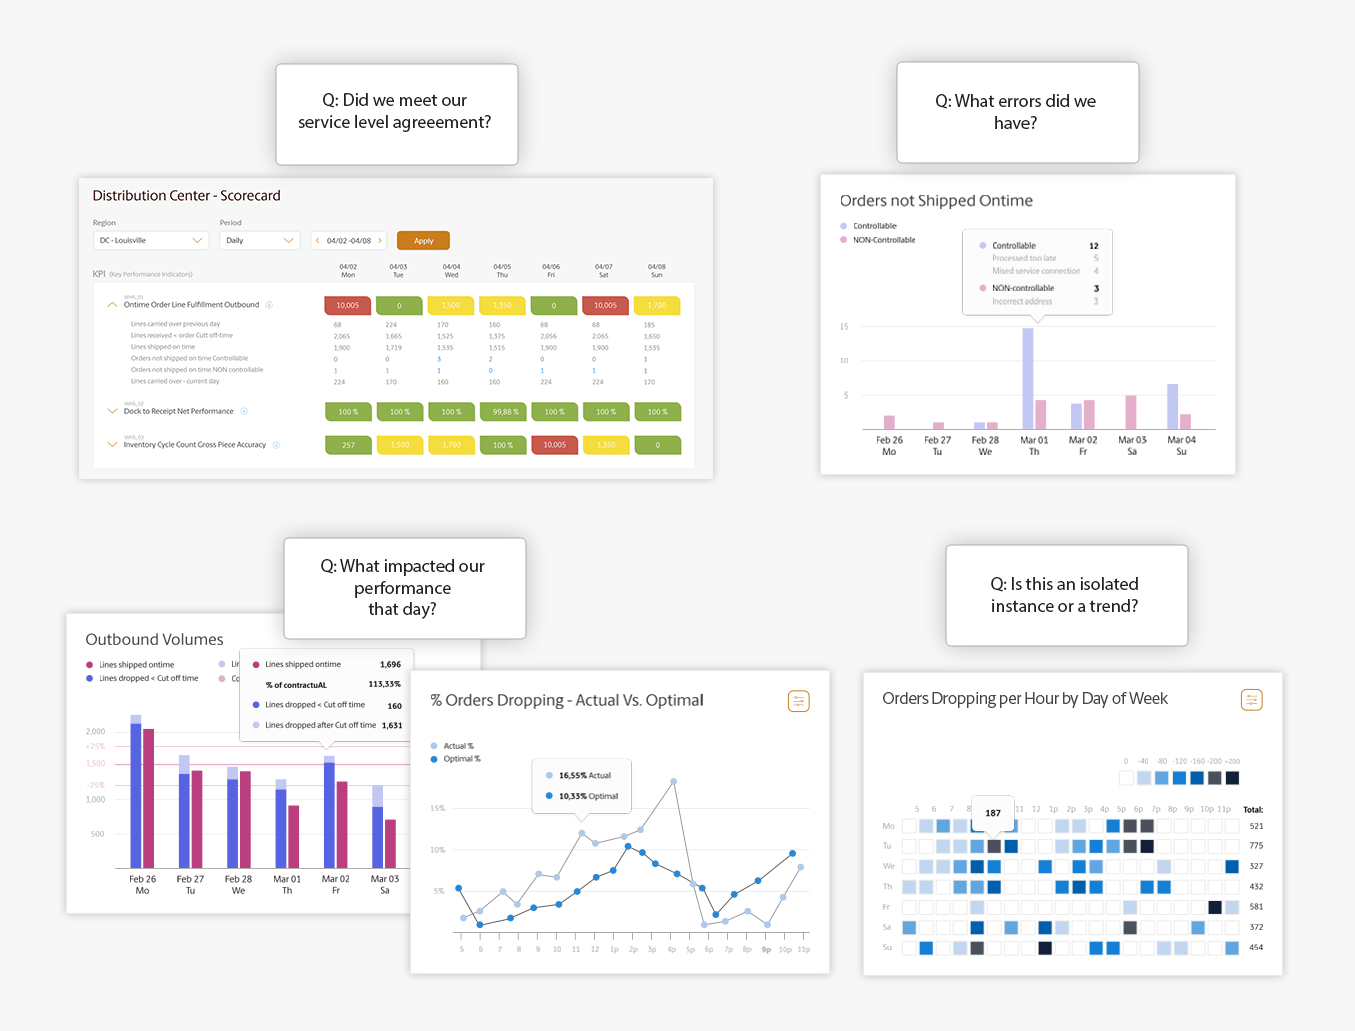
An example of a root cause analysis - the Operations Supervisor can navigate between the Scorecard and the Dashboard to understand what happened and why.
Through discovery and feedback sessions with the users, we designed our new online data collection tool, scorecard, and dashboard to work together to allow users to perform multi-layered analyses. Because data was stored on the cloud, users could go back in time and create weekly, monthly and quarterly summery views and trends.
Root cause analysis done with data visualizations
ideation on paper
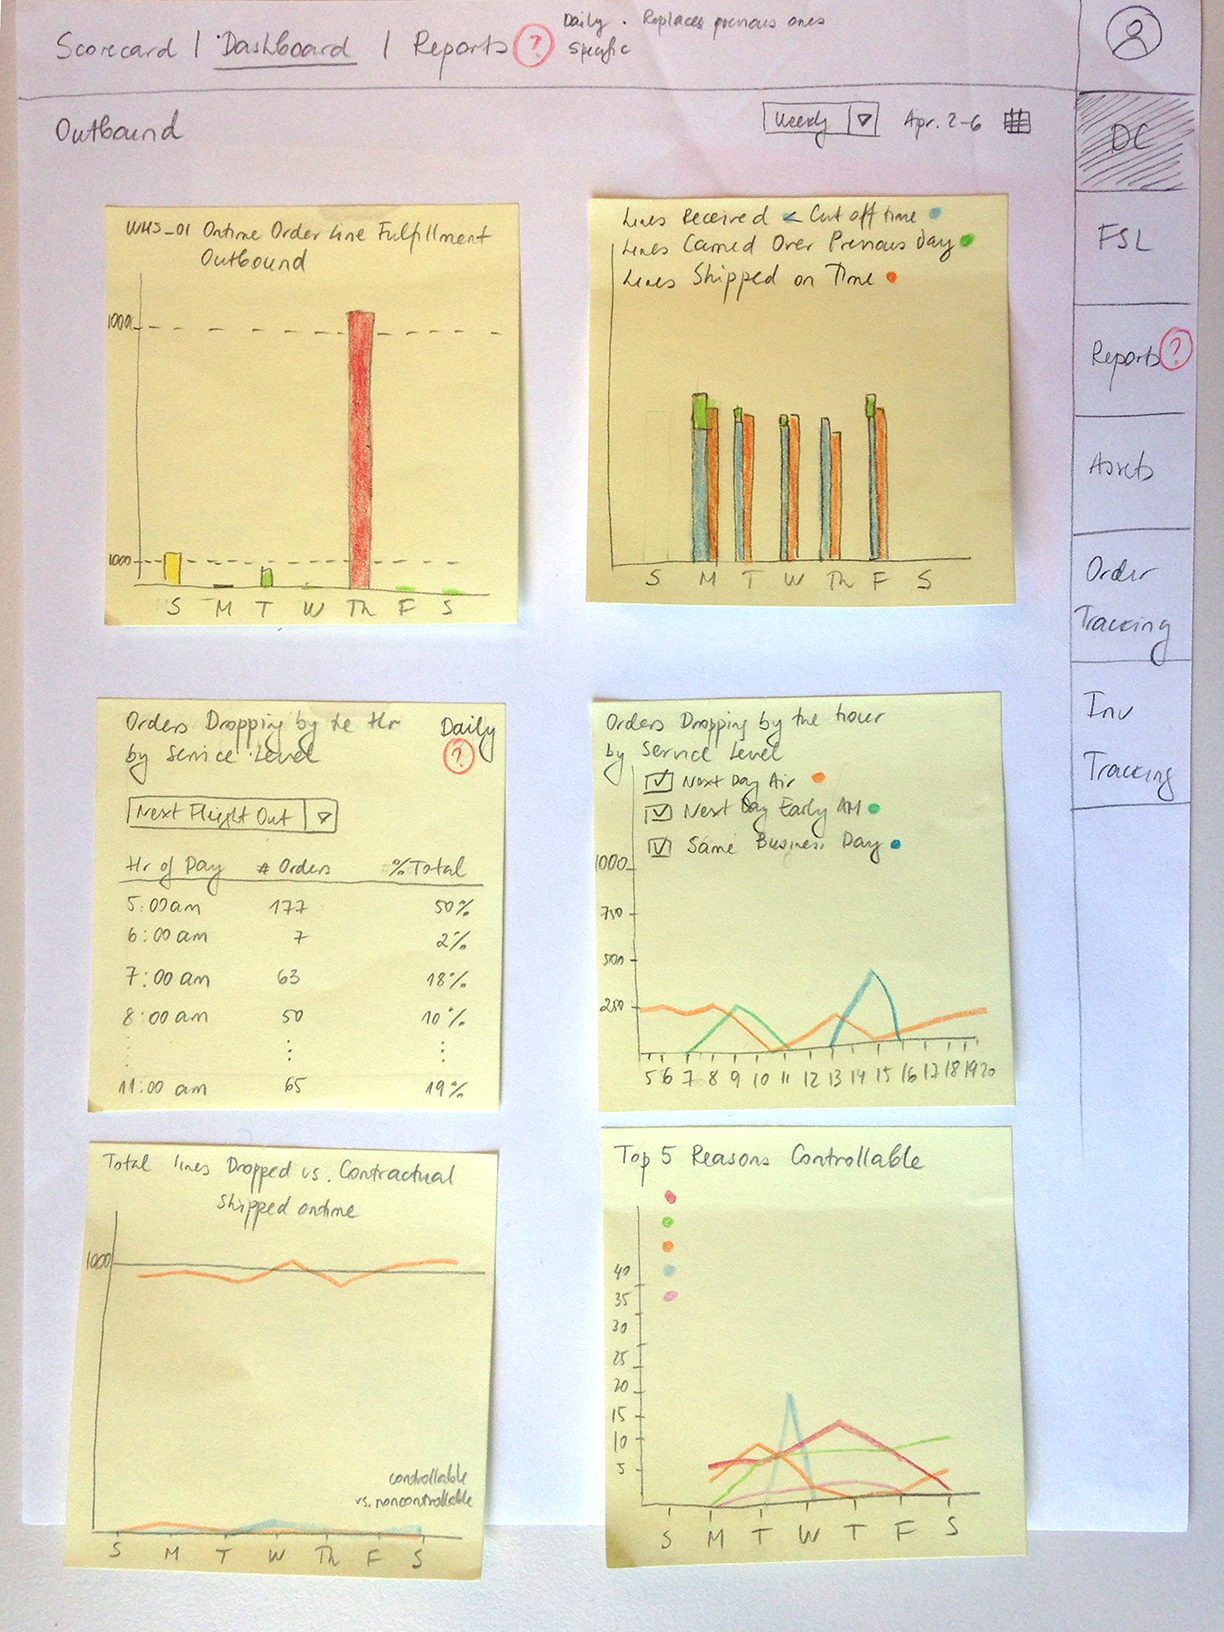
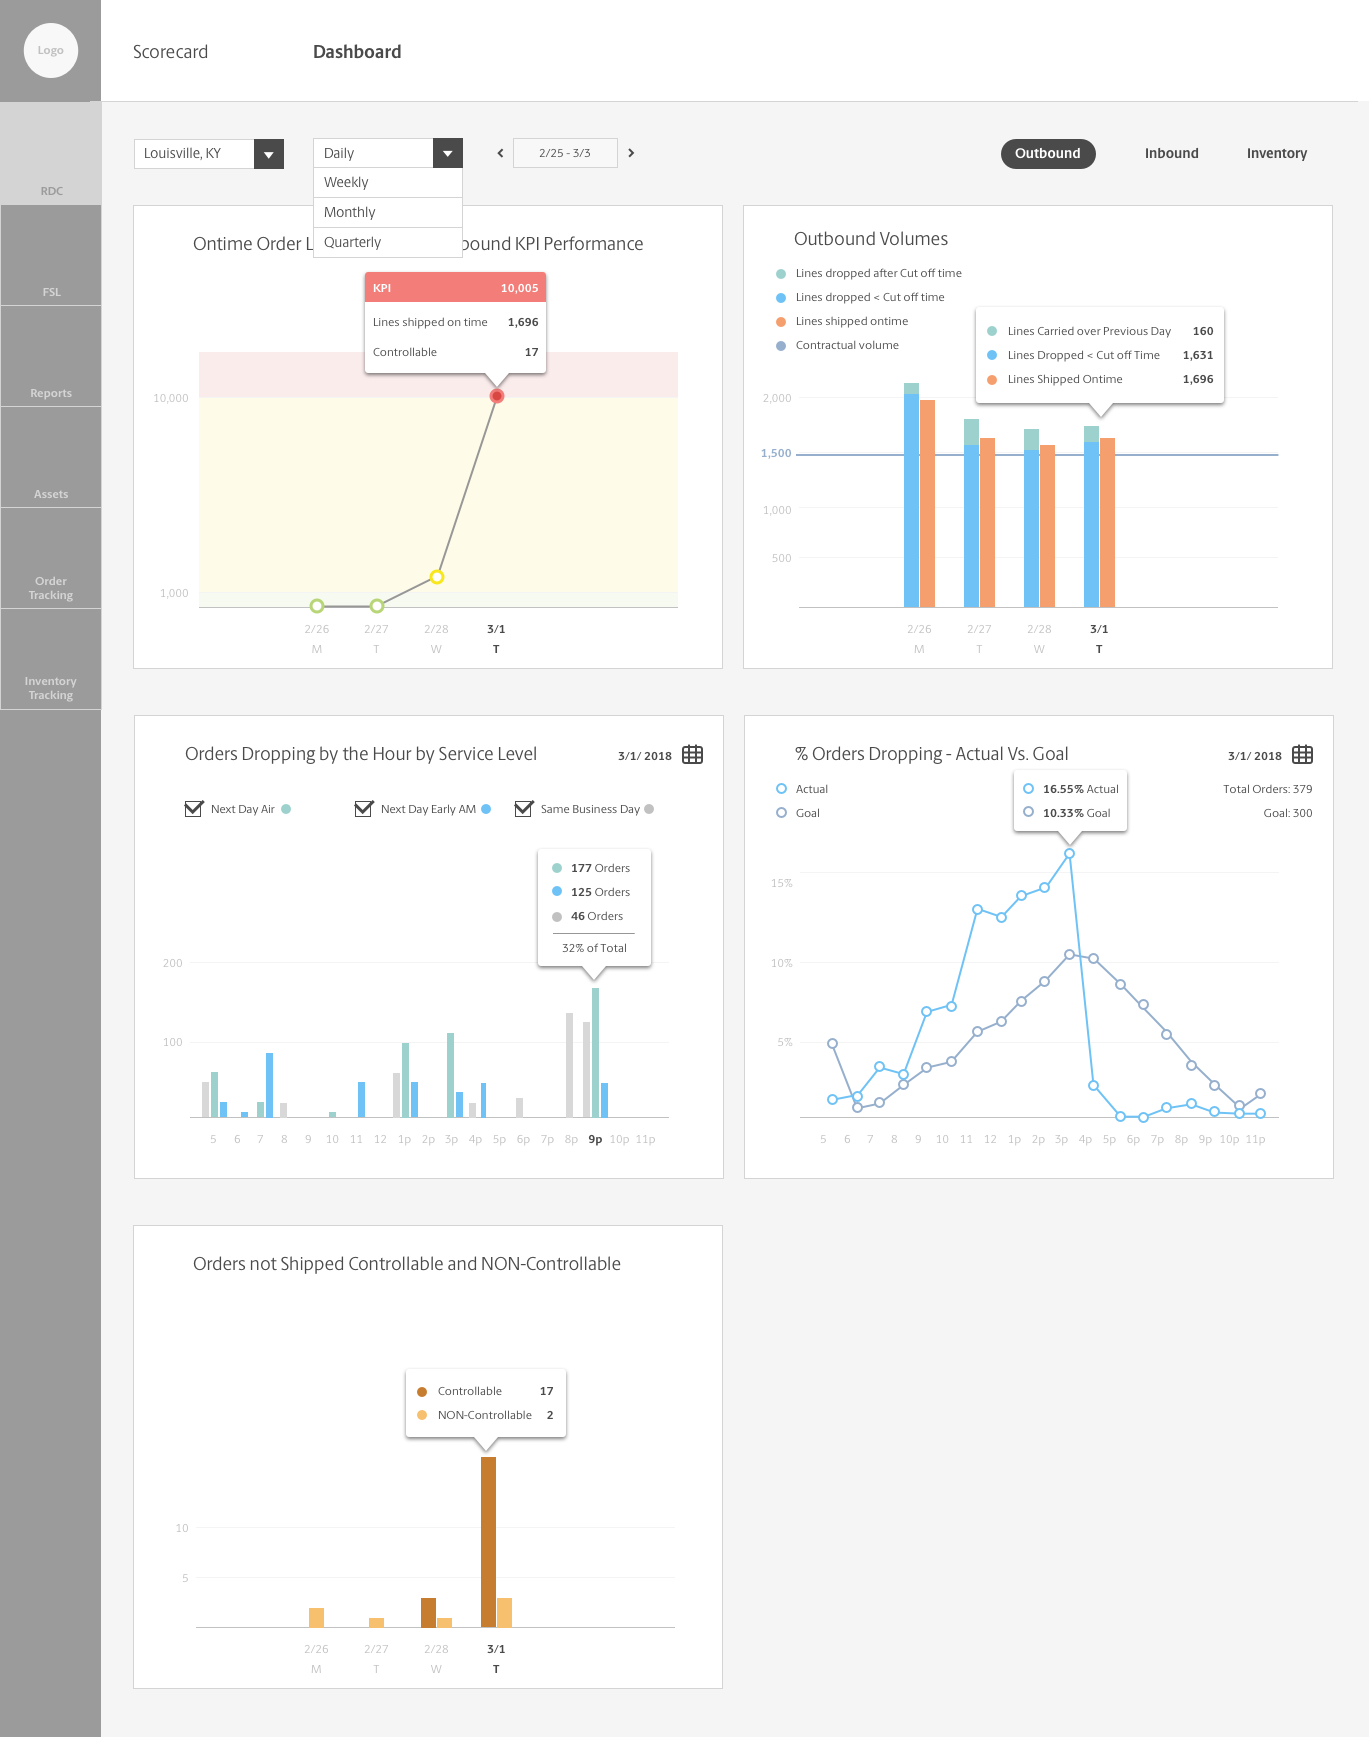
Prototype in Sketch
PROJECT OUTCOME
Two years later we had a working Portal that showed data for the inbound, inventory and outbound warehouse operations for two different types of warehouse facilities. We had a KPI reporting area (online Scorecard), a dashboard, reports, a data collection area and an online shared space. The project was then handed over to a third party for further development. The current UPS Supply Chain Symphony Portal is heavily based on the initial Global Logistics and Distribution Portal.
Screenshots from the Portal as it was handed over to an external company for further development
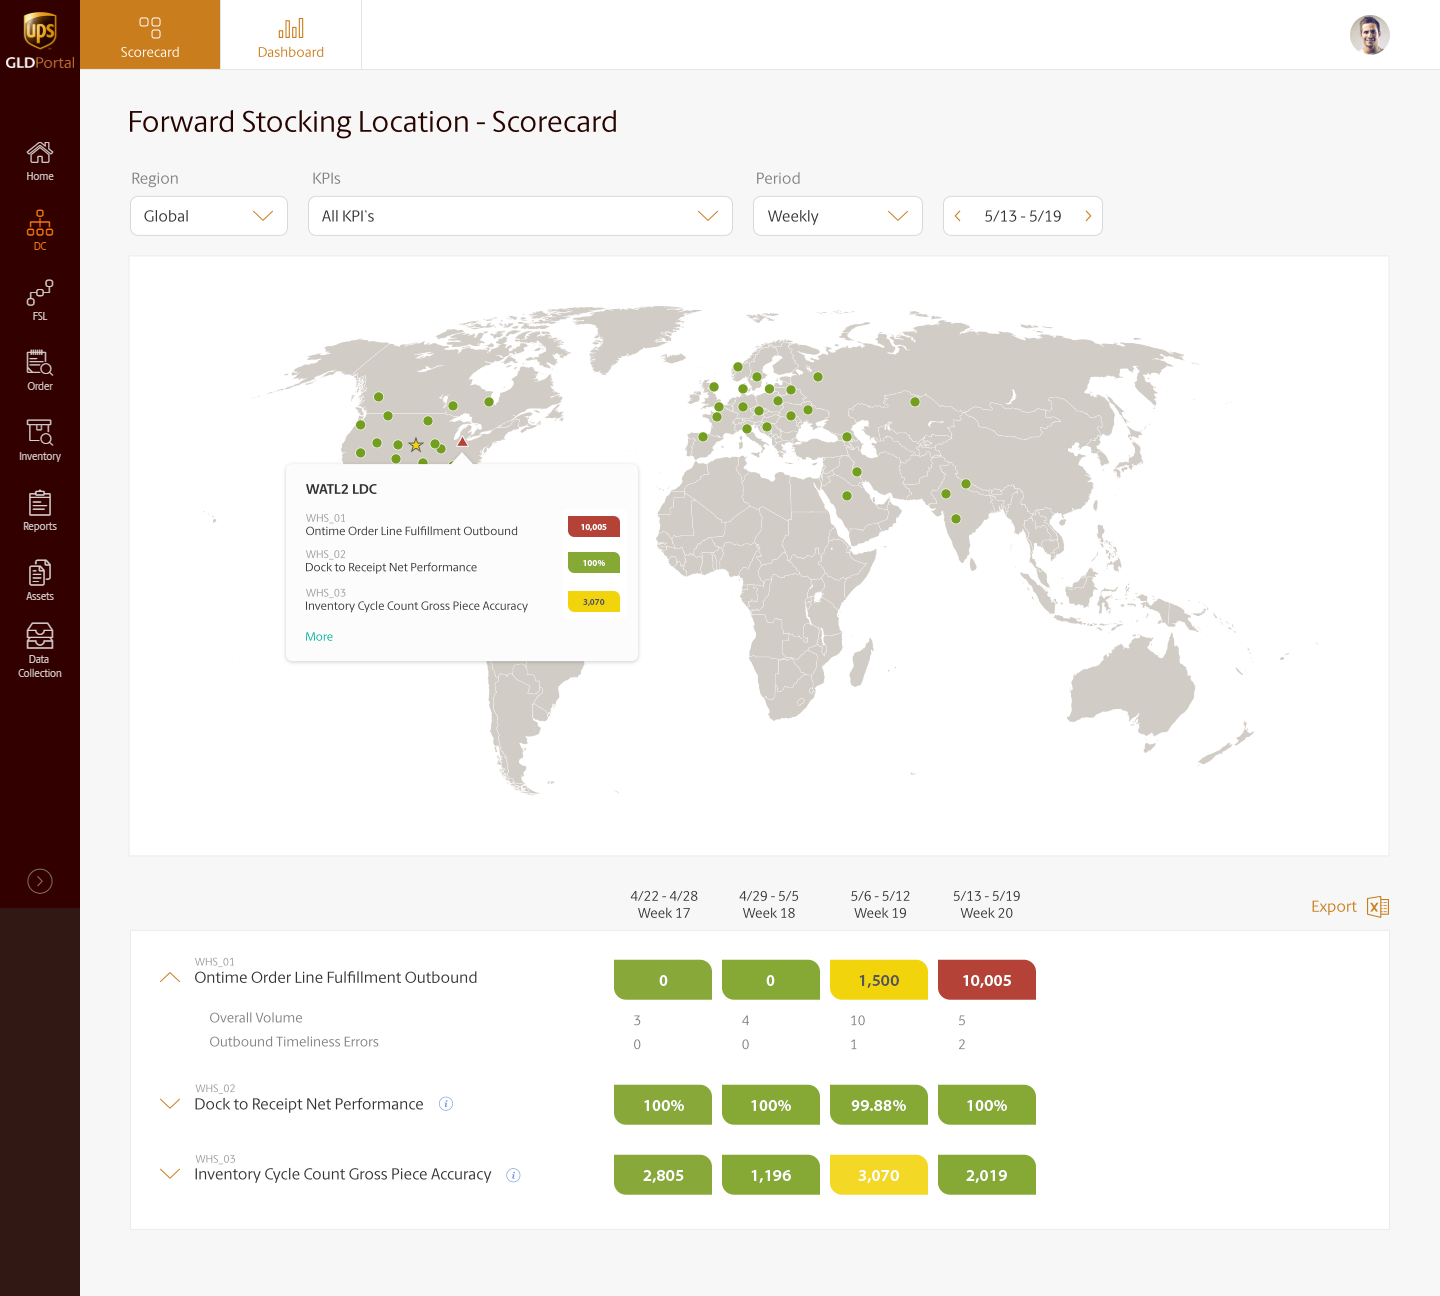
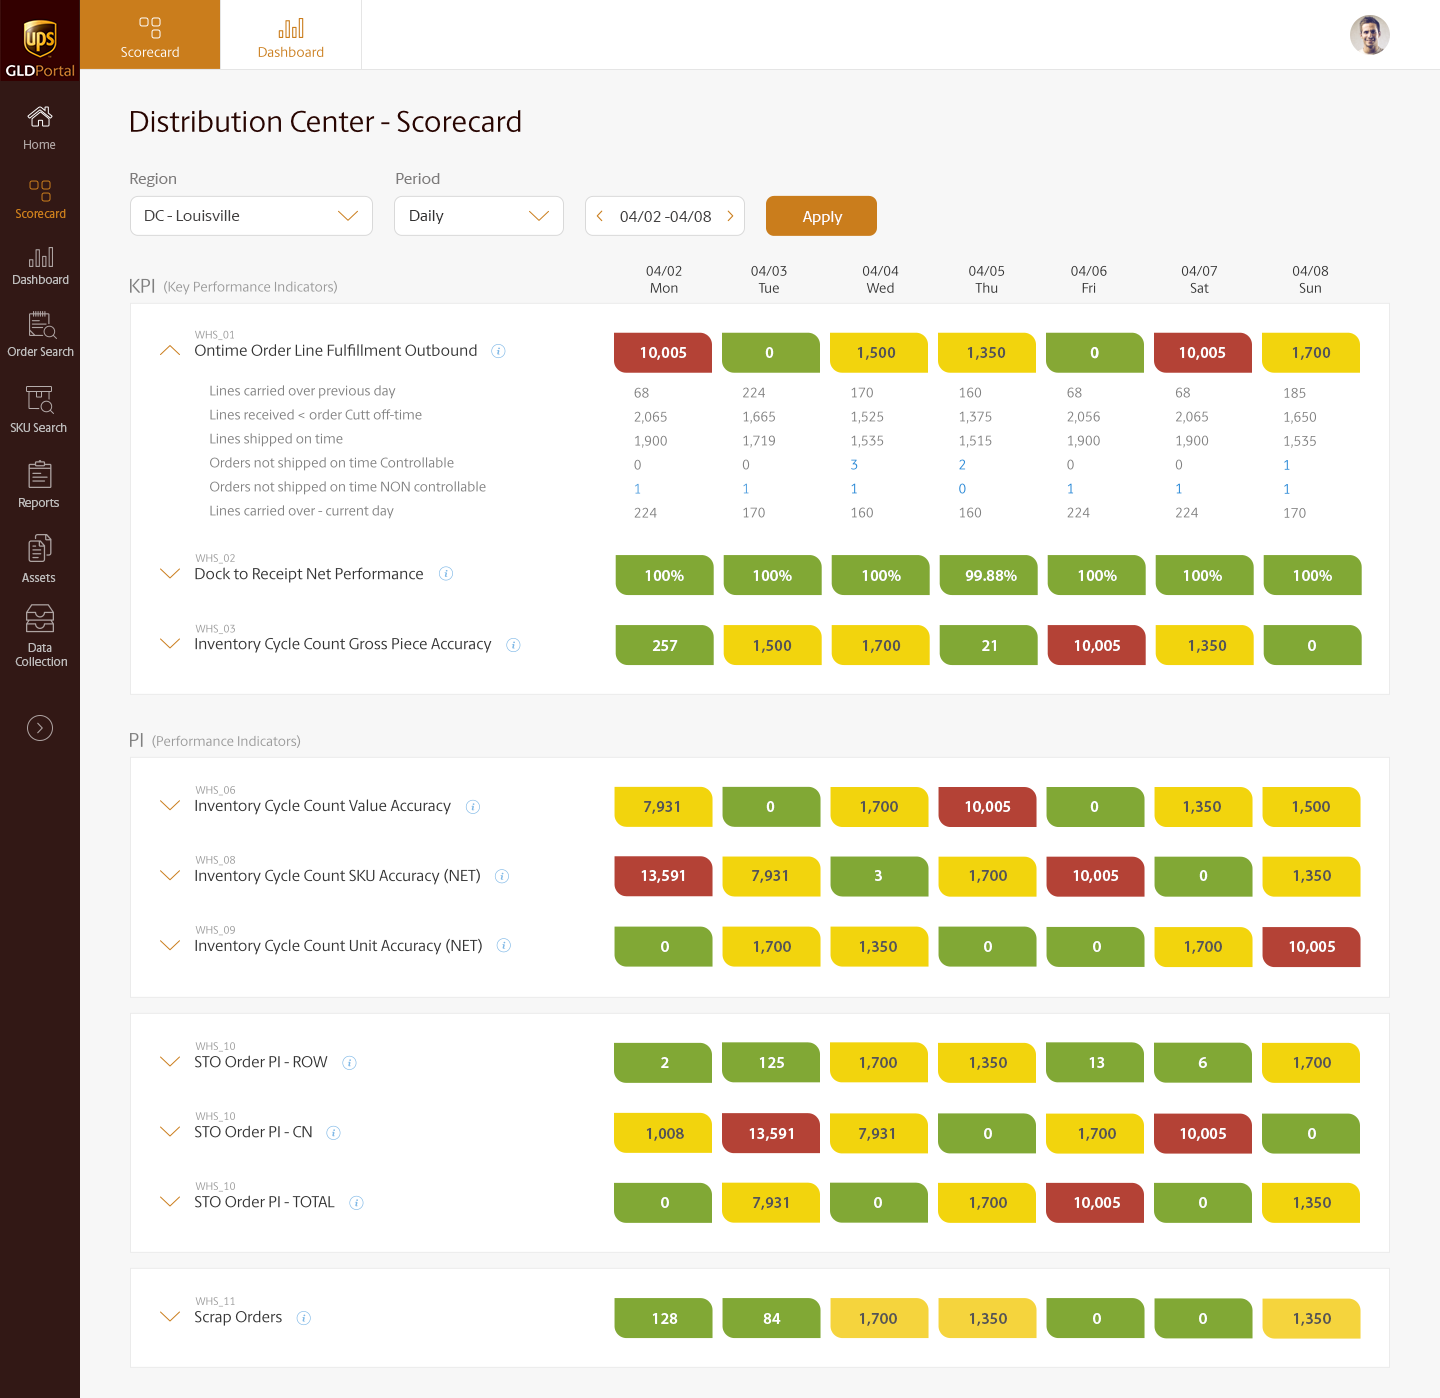
Distribution Center Scorecard
Distribution Center Dashboard
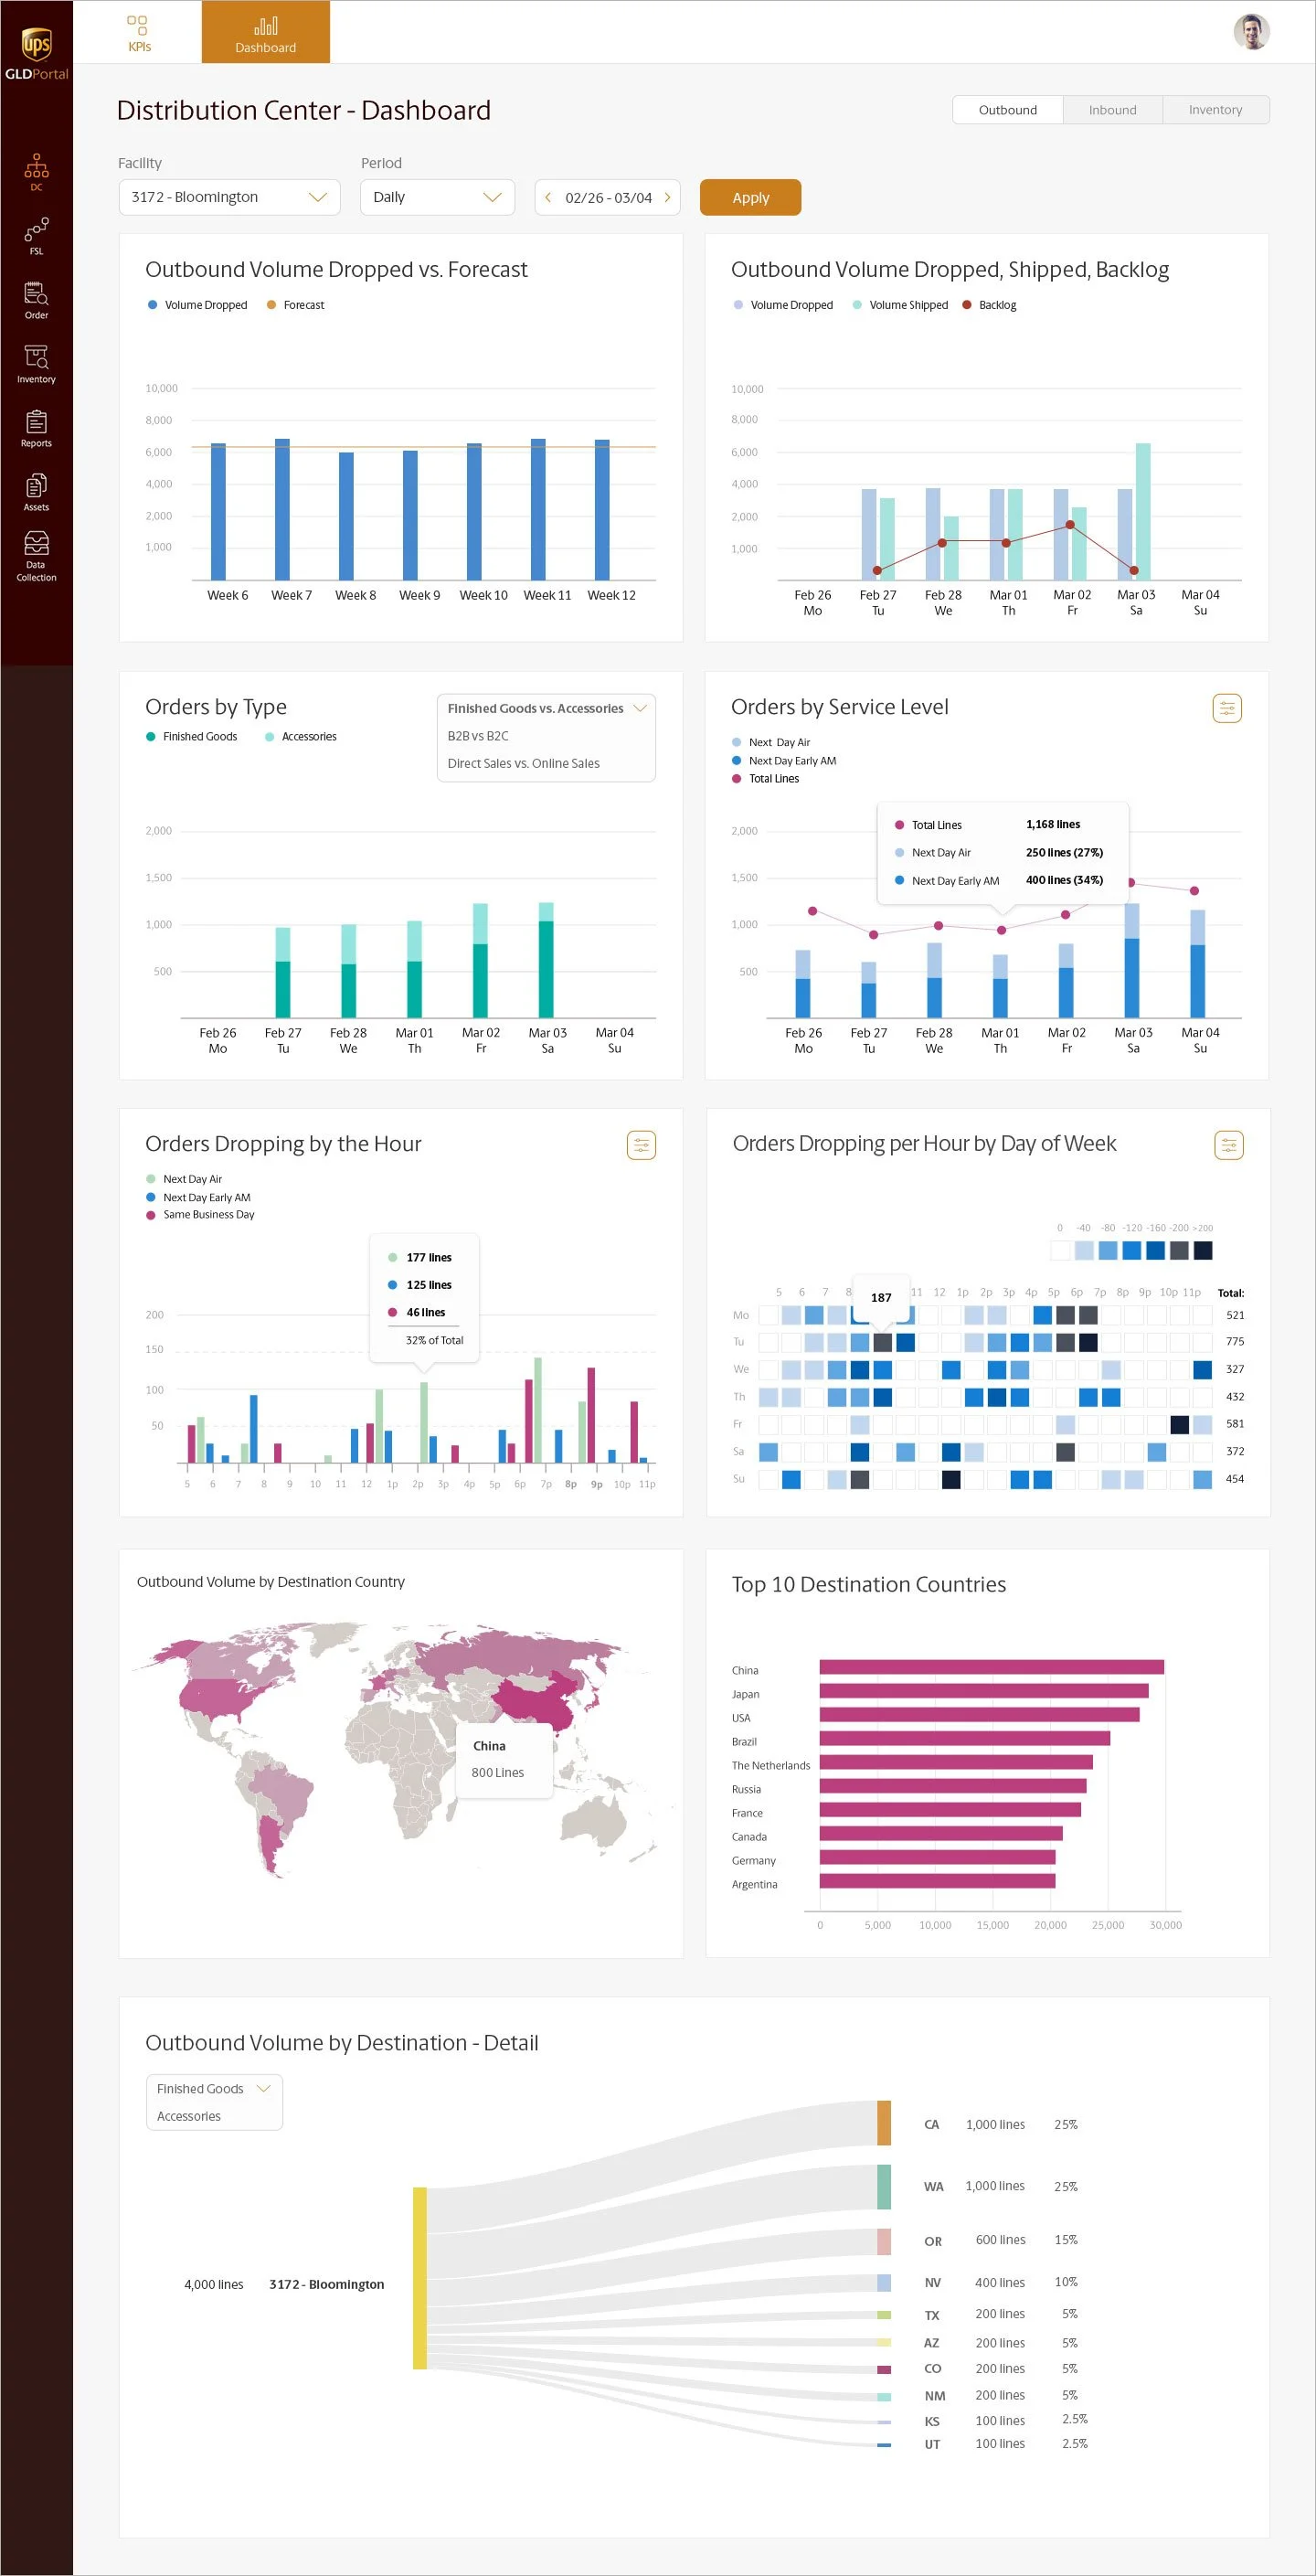
Forward Stocking Locations Dashboard

Forward Stocking Locations Scorecard